A Look at the City of St. Louis’s FY2017 Comprehensive Annual Financial Report (CAFR)
The Big Picture
The City is in a position of deteriorating fiscal health. There are a number of factors influencing this reality, and we will do our best to highlight those that we believe to be significant enough to warrant public attention. Like our review of the annual budget proposal, this is not meant to be an exhaustive look at every investment’s performance, etc. We will instead be looking the performance of broader revenue streams, debt load, spending level changes and the City’s total balance of assets/revenue to debt/obligations, which is known as the Net Position. As with the budgetary analysis, Team TIF strives to help St. Louisans better understand our city’s fiscal health. We believe that a more informed citizenry is necessary to drive racially equitable and fiscally responsible policy decisions by our elected officials.
Report Opens With Dour News About City’s Net Position
Opening the report, it is clear that the City’s Net Position has suffered another year of significant decline. FY2017 ended with the City showing a Net Position of $646.5M1, down from FY2016’s ending balance of $744.7M, and that number, in turn, was a decline from FY2015’s ending balance of $829M2.
The Comptroller then goes on to highlight significant debts and obligations that are contributing to the City’s declining Net Position. The biggest factor cited is pension obligations3 that the City continues struggling to pay. Other large debts highlighted4 are:
- Section 108 loan obligations - $22.2M
- Joint venture to expand the Convention Center - $24.1M
- Convention Center Hotel - $22M
- Downtown development “component units” - $15.1M
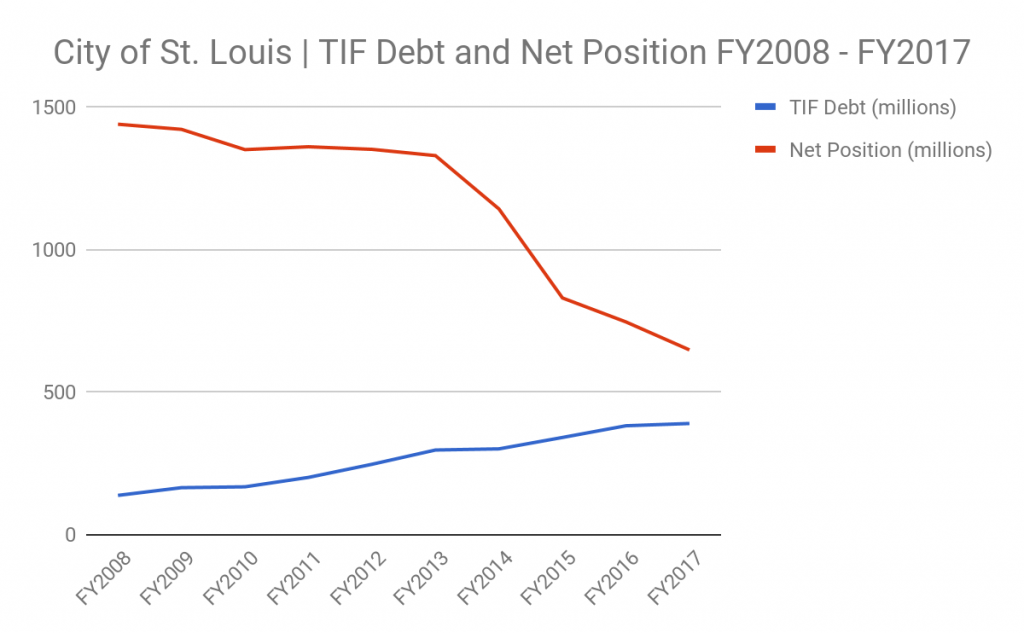
- TIF financing debt - $388.7M
As you can see, TIF financing debt dwarfs all of the other noted debts, excluding pension obligations.
Overall Change in Revenues and Expenses
Moving on, we see that both City revenues and expenses have climbed, in the past year5. First off, let’s take a look at the City’s revenue picture.
Revenues
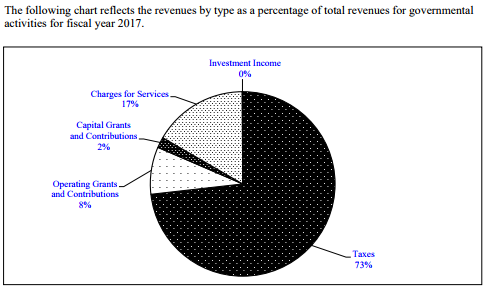
From FY2017 CAFR
Revenues climbed to $1,064,300,000 from $1,030,300,000. Most of the revenue increase came from increasing tax revenue, while charges for services and other non-tax revenues essentially held steady.
While we saw Gross Receipts, Earnings Tax and Other Tax revenues exceeding the year’s budget estimates, these gains were dwarfed by overly optimistic Sales, Franchise, Payroll, Property and Motor Vehicle Taxes6. The biggest prediction failures were for Sales and Franchise taxes, which missed the mark by $2.51M and $2.87M, respectively. Overall, the City’s tax revenues fell $6.33M short of the year’s budgetary projections.
On the non-tax side, an $817k increase in fees for services was almost completely wiped out by an $804k loss from declining license and permit revenues. There was also an overall $827k decline in revenues from other governments, led by $958k in lost public safety funding. It is unclear what this sizeable loss was caused by or if it is only a one-time loss.7
Overall, the City’s revenues fell $7.54M short of budget projections.
Expenditures
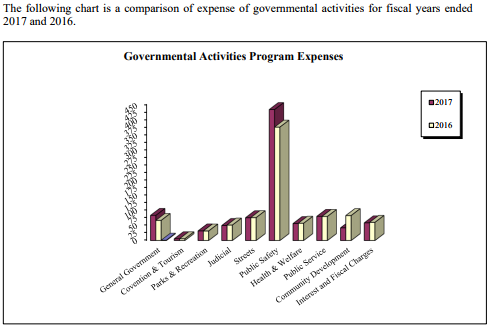
From FY2017 CAFR
On the expenditures side, most departments found their expenses to be fairly steady. There was a decent number of departments with modest increases or declines. There was one city department that set itself apart, seeing a major increase: SLMPD funding ballooned to $280.3M from a previous year’s spending level of $226.5M ($53.8M increase, a 23.75% increase over previous year). It should be noted that this increase includes none of the overtime that was initiated in response to protests following the acquittal of Jason Stockley. One can assume that next year’s SLMPD spending level will be even higher than this past fiscal year, due to overtime spending that has been repeatedly referenced by many media outlets and City officials.
To offset this year’s massive increase in funding for SLMPD-related costs, one sector of the government appears to have taken the largest hit: Community Development. While SLMPD funding increased $53.8M, the city’s investments in community development spending declined by $35.2M, which represents a 42.67% decrease in that department’s spending. While other departments saw much smaller cuts, Community Development bore the brunt of the increased police spending.
Other areas seeing noticeable, but more modest, increases were the Fire Department ($4.4M), Water Department ($11.2M) and General Government ($16.6M)8.
The Effects of TIF and Tax Abatement
TIF Costs Weigh Heavy on City
The cost of TIF financing continues to be a major drag on the City’s fiscal position. TIF obligations (as of June 30, 2017) are projected to cost the City around $45.5 million per year, for the next ten years. FY2017 saw an issuance of $19,794,000 in new TIF obligations9. Obviously, any TIF financing that occured after this time would increase our annual costs associated with TIF. In fact, the report notes that between June 30th and the publications of the FY2017 CAFR, an additional $2,997,000 in TIF notes were issued with an interest rate of 6.55%10. This interest rate appears to be higher than the rates we were paying just a few years ago. It is likely that this increase is the result of the city’s multiple bond rating downgrades, which increase the City’s borrowing costs.
Over the next 27 years, the City is projected to spend $636,466,000 in service of the TIF obligations that the city had issued as of June 30, 2017.
Abatements Continue to Generate Significant Losses for Taxing Districts
The effect of real estate tax abatements on the City’s main governmental budget is significant but less dramatic. Most of these losses are born by Saint Louis Public Schools (SLPS), the Zoo Museum District (ZMD), and other taxing jurisdictions that rely on property taxes. According to the CAFR, the following totals break down the negative impact of real estate tax abatement programs in FY201711:
- Chapter 353 residential abatement: $954,000
- Chapter 353 residential PILOT: $88,000
- Chapter 99 residential abatement: $1,634,000
- Enhanced Enterprise Zone abatements: $1,859,000
- Chapter 353 Commercial abatements: $4,873,000
- Planned Industrial Expansion: $152,000
- Chapter 353 Commercial PILOT: $129,000
- Chapter 99 Commercial abatement: $6,159,000
- Chapter 100 Industrial Revenue Bonds and related credits: $995,000
Total losses to real estate tax abatement incentives is $16.843M. About 60% of the lost revenues comes from the school district, while the City is projected to have lost roughly $3M in annual revenue.
Public Pension Funds are in Varying States of Health
Police Pension Obligation Issues Escalating Rapidly
The issue of police pension solvency was a topic of interest earlier in the year, with some at the Board of Aldermen, where there was some discussion of using part of the future Prop P sales tax levy to fill some of the gap in the City’s police pension obligations. Highlights from the CAFR include12:
- FY17 ended with total pension liabilities of $1,089,317,000
- FY16 ended at $944,138,000
- FY15 ended at $919,606,000
- As with the decline of the City’s overall net position, the City’s rapidly escalating police pension cost issues are far outpacing the rate of inflation.
- Annual pension obligation increase of $145,179,000. This amount is greater than the City’s overall reduction of net position of $98,300,000.
- FY17 ended with a net pension liability of $380,079,000
- FY16 net liability was $259,243,000 | FY15 net liability was $190,840,000
- In FY15, liability as a percentage of current employee payroll was 264.50%. By the end of FY17, that number roughly doubled to 522.92%
It is that growth of the fund’s net pension liability that is of the greatest concern. It is showing signs of unusually fast increases. Even though staffing levels were down, the fact that net pension liability almost doubled and rose to more than 500% of current payroll is alarming. With vacancies filled and the Prop P-related raises coming to the department, one can see how that massive increase in police payroll brings the level down to something more reasonable, but at a great cost and for how long? Also, these new higher salaries will result in higher pension obligations, going forward. As such, increasing payroll will come with increasing costs, and this will blunt positive effects on the pension fund’s health. At over a billion dollars and growing, the police pensions could be a ticking time bomb that nobody has yet shown the courage to address.
Firefighters’ Pension a More Complicated Picture
With their pension system being split into separate funds for workers that joined the force at different times, the firefighters’ pension picture is somewhat more complicated13:
- FY17 ended with a total of $489,518,000 in “Firemens Retirement System” liabilities
-
- FY16 ended at $495,019,000
- FY15 ended at $451,542,000
- It is unclear why the firefighters pension fund got healthier, while the police funds obligations continued to grow in FY17. Both saw increasing liability in FY16. Most likely rationale is that it is the older fund and the number of retirees collecting on this particular fund is declining due to mortality.
- Similar payroll comparisons show that the net pension liabilities of the firefighters older pension system is at 118.73% of current payroll in FY17, an improvement from FY15, when it stood at 144.61%.
- FY17 ended with a total of $101,984,000 in “Firefighters Retirement Plan”
- FY16 ended at $88,780,000.00
- FY15 ended at $52,268,000.00
- Increases in this smaller pension system far exceed the net decrease in the older system’s liabilities, meaning total firefighter pension liabilities continue to grow.
- This fund also saw a year-to-year improvement of the amount of pension liabilities as a percentage of employee payroll, decreasing from 166.06% in FY16 to 158.41% in FY17. Overall the trend is still toward increase, when compared FY15’s figure of 92.76%.
- A table on page 157 shows a possible explanation for the firefighters fund showing small year-to-year increases, compared to the police fund, in that 2016 shows greater contributions than determined necessary. This only occured in FY16.
General Employees’ Pension Fund Looks Relatively Healthy
The numbers for the City’s general employees’ Pension (aka Employees Retirement System of the City of St. Louis) are relatively healthy, compared to either the police or firefighters14:
- For unknown reasons, this fund report only shows net liabilities, not total
- Proportion of pension liabilities to current payroll is showing modest but steady improvements. In FY17 that number stood at 83.20%, down from 83.5% in FY16 and 83.9% in FY15.
The City’s Net Position is Rapidly Eroding
At the beginning of the report, we were able to see that the city’s net position has been deteriorating, but only a table towards the end shows the dramatic nature of the decline. This chart shows that the City is going through a period of Net Position erosion that is quite dramatic15:
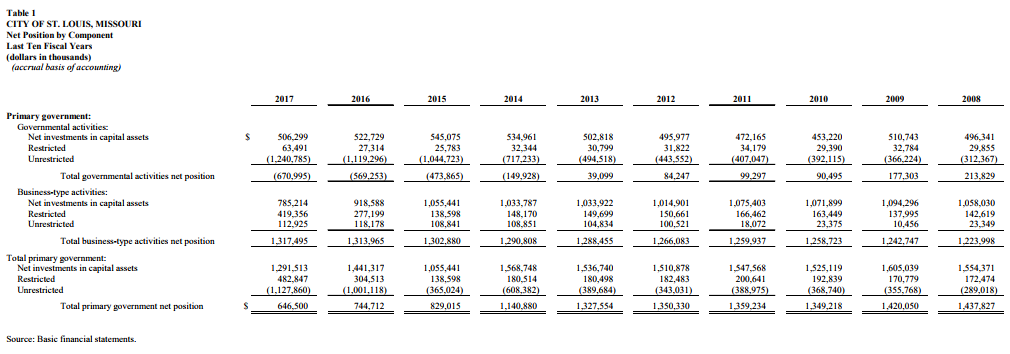
From FY2017 CAFR
The City’s Net Position held fairly steady at $1.3-$1.45 billion, for many years after the 2008 recession. After FY2013, the City’s Net Position has begun a dramatic decline. Some of this is due to the large debt load that was taken on, in order to win the NGA site selection process, though that can’t account for the entirety of the City’s declining fiscal position.
In 2013, the City’s net position was valued at $1.32 billion. As of June 30th of this year, it had halved to $646.5 million. The rate of the City’s Net Position decline slowed between 2015 and 2016, but has begun accelerating between 2016 and 2017. That the City’s Net Position has been halved in only a handful of years is of great concern. This declining position of is especially concerning, as the Comptroller notes that the Scottrade bonds hadn’t been signed, which would have added another $64M in obligations to the City’s books16. This would have further decreased the City’s Net Position, but litigation held up the issuance of the bonds.
Conclusion
It is safe to say that the City’s fiscal troubles are not only continuing, but appear to be escalating. It must be remembered that these troubling numbers come in a time of economic expansion and rising wages, thus causing concern for the City’s ability to handle any kind of economic downturn. With rising levels of debt and other obligations (compounded by declines in the rate of growth of many of the City’s significant revenue streams), it is a tough time for the City’s financial health. That the decline in the City’s Net Position seems to be accelerating should be of concern to everyone who lives, works or plays in St. Louis. Recently passed sales tax revenues will increase that stream, but much of this new revenue is dedicated to going to pay for contractually obligated police and firefighter increases. Of the remaining monies, it is likely that much will simply be used to replace General Revenue Fund spending that is going towards increasing policing, pension, and debt service costs. This means that it is likely that St. Louis voters won’t really see promised significant new spending on Community Development and other areas (compared to many recent years), as this money will simply be restoring cuts. Additionally, it is very likely that the significant and continuing drop in Net Position, along with the subsequent addition of $64M in Scottrade-related debt, will put us in the position for potential additional downgrades from ratings agencies. Each downgrade in bond rating increases new borrowing costs to the City.
All footnotes refer to page numbers in the City’s FY2017 CAFR.
1Page 4
2Page 10
3Page 11
4Page 9
5Page 10
6Page 144
7Page 144
8Changes in expenditure levels all found on page 10
9Page 112
10Page 143
11Page 140-142
12Page 152
13Page 154-157
14Page 158
15Page 191
16Page 143