Instructions
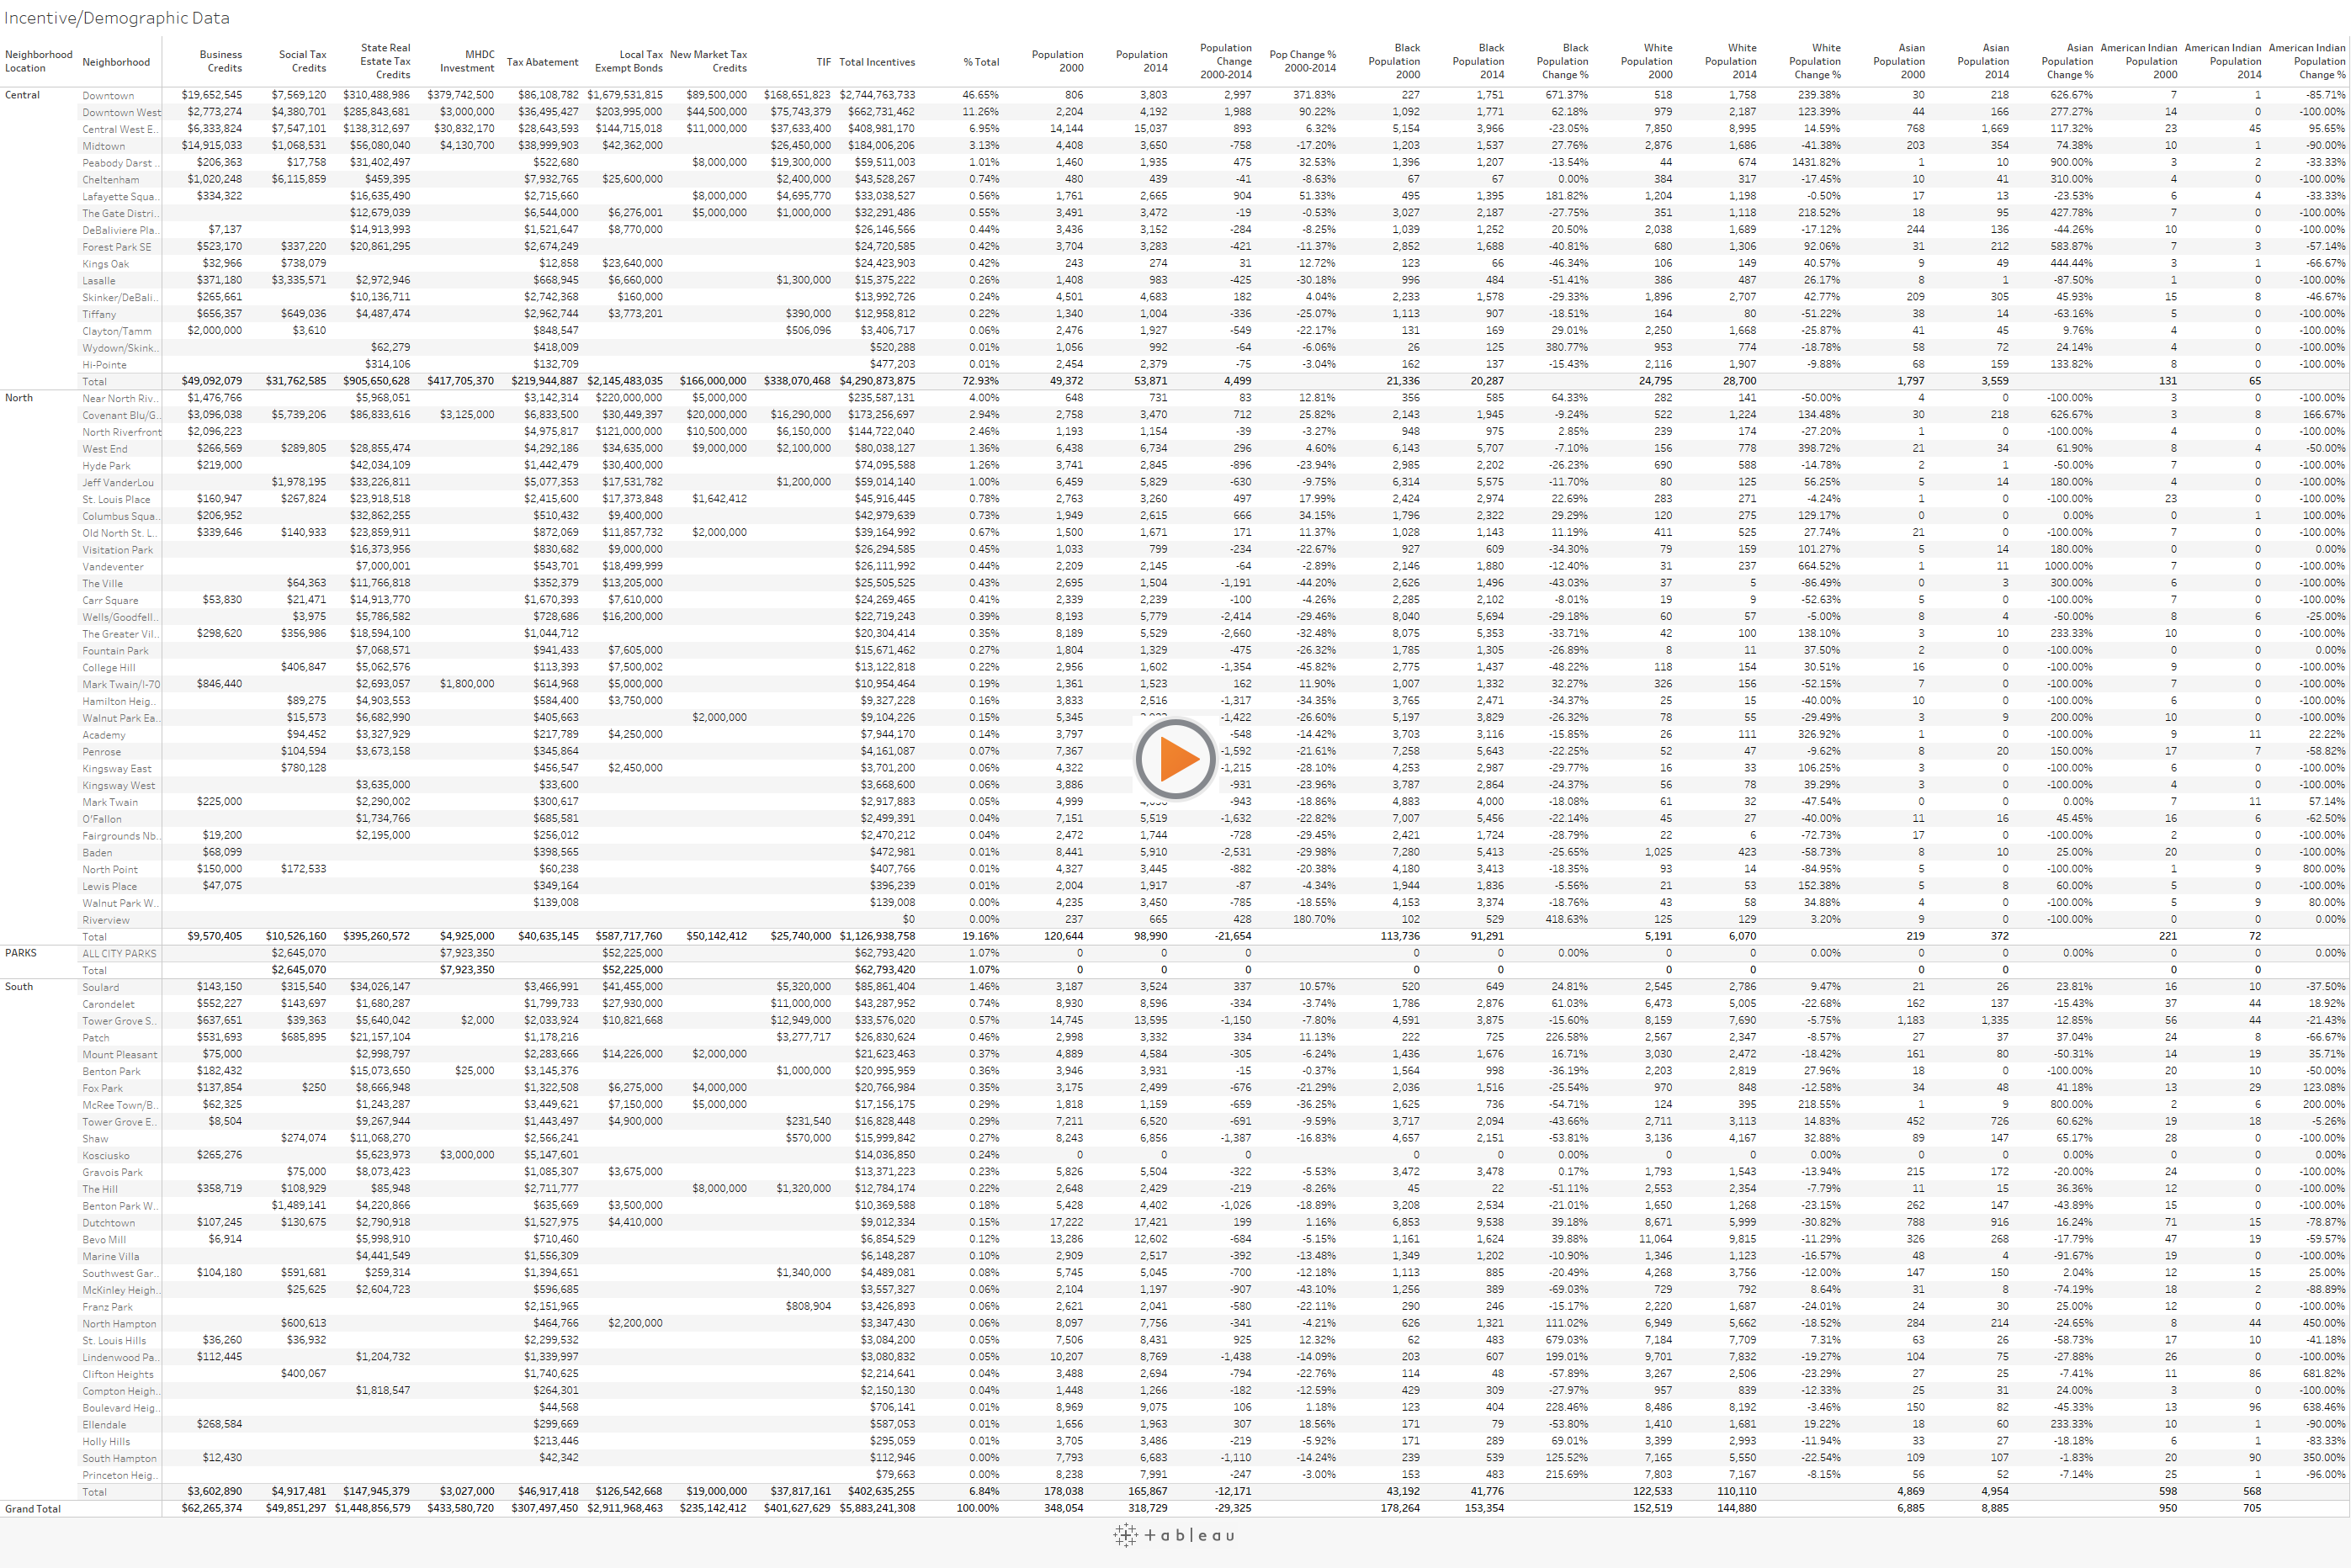
Use the filters to the right to filter by corridor(s) or neighborhood(s). The subtotals and totals at the bottom are dynamic and will change depending on your selections.
There is a full screen toggle at the lower right-hand corner of the data table.
*Note: This assumes all development would have happened without the incentives. While this is likely not the the case, there is no way to estimate what would and would not have been built, as that is not a data point that the city or state tracks. Therefore, absent the presence of publicly available generated tax revenue data per incentive package, there is no way to track return on investment, and this is as detailed as the analysis can be at this time. Should more information become available, this analysis can and will be adjusted to reflect that data.
Sources
Population Data
2000 Census: http://dynamic.stlouis-mo.gov/census/city.cfm
2014 ACS Estimates: http://stlcity.maps.arcgis.com/apps/MapSeries/index.html?appid=e40839bba6e94ea699006146fa7d7b96
Corridor Breakdowns follow this definition: https://nextstl.com/2014/09/pxstl/
Incentive Data
Incentive Data by Neighborhood: Pages 65-69 of St. Louis City Economic Incentives Report – Draft Final, September 2015