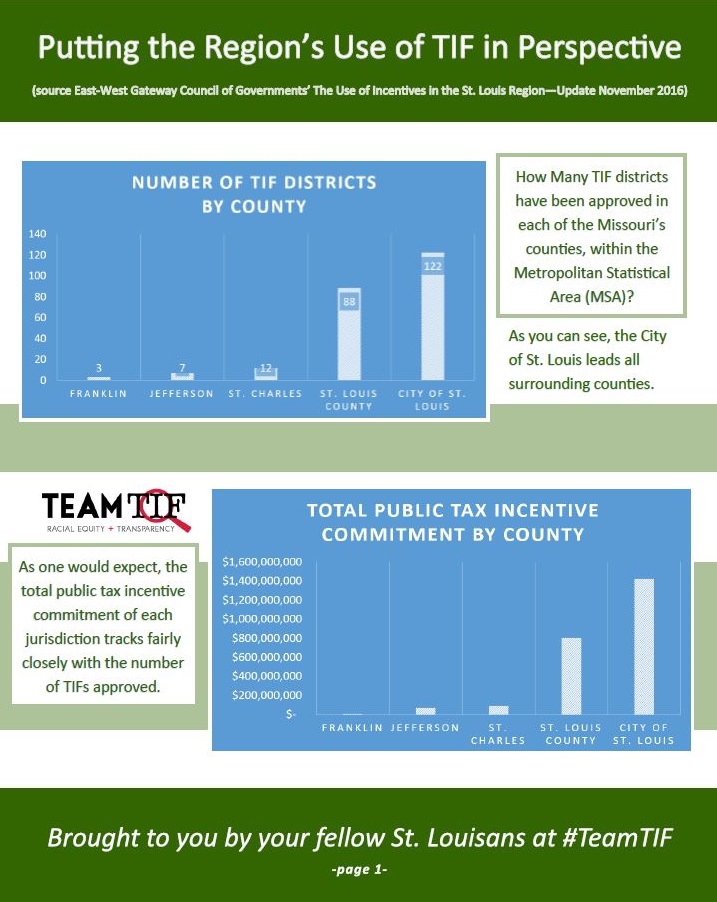
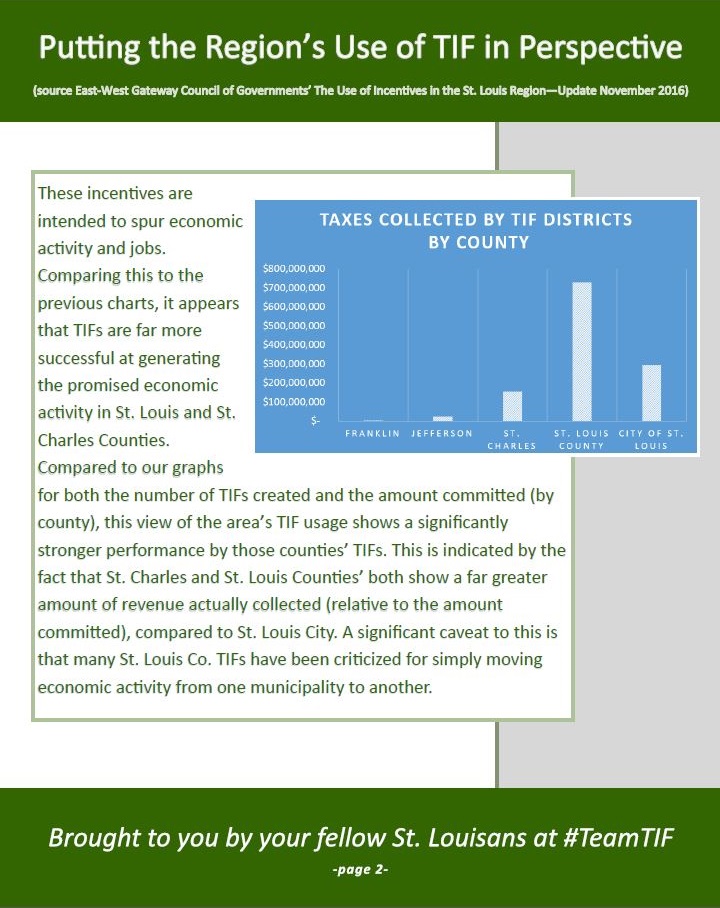
The graphic below illustrates the information contained in the November 2016 update from the East-West Gateway Council of Governments. As you can see, TIF usage throughout the region varies widely, in both pure dollar value and number of TIF Districts.
It should also be noted that these figures comprise all TIF Districts that have been approved; some of which have had bonds issued already, and some of which have not.
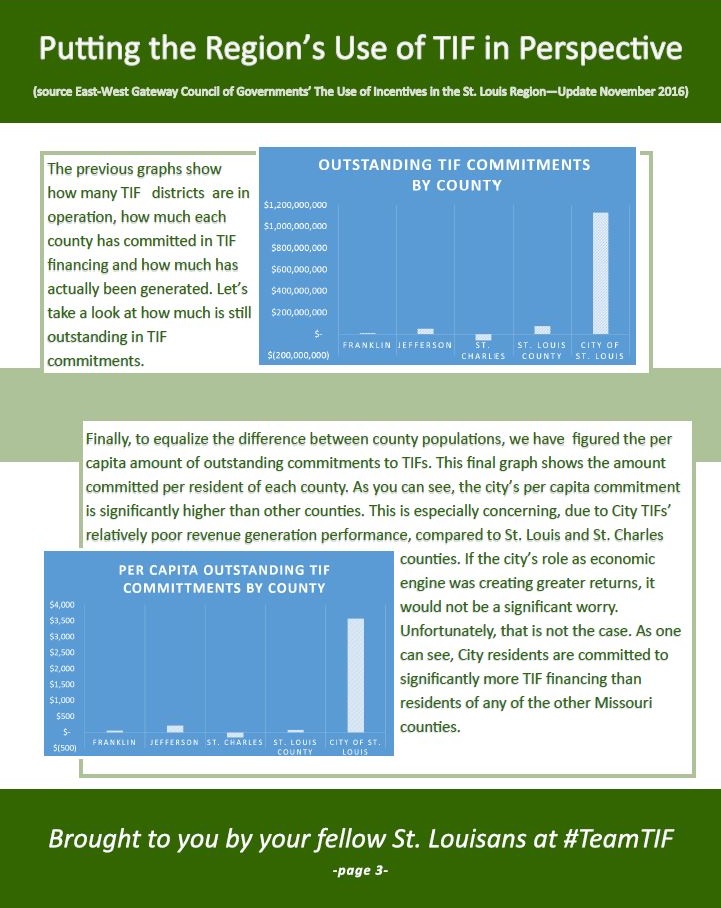
The per capita commitment also shows wide gaps, and is not meant to imply any relationship other than a gauge of how many TIF dollars are approved relative to a given county’s population. This figure is not meant to imply that every person in the individual county would be responsible for that amount of TIF debt were the county to default on the payments and should not be construed as such.
Source: http://www.ewgateway.org/dirr/comrpts/DevIncentivesRpt-2016-1.pdf